流程序列
Process Sequence
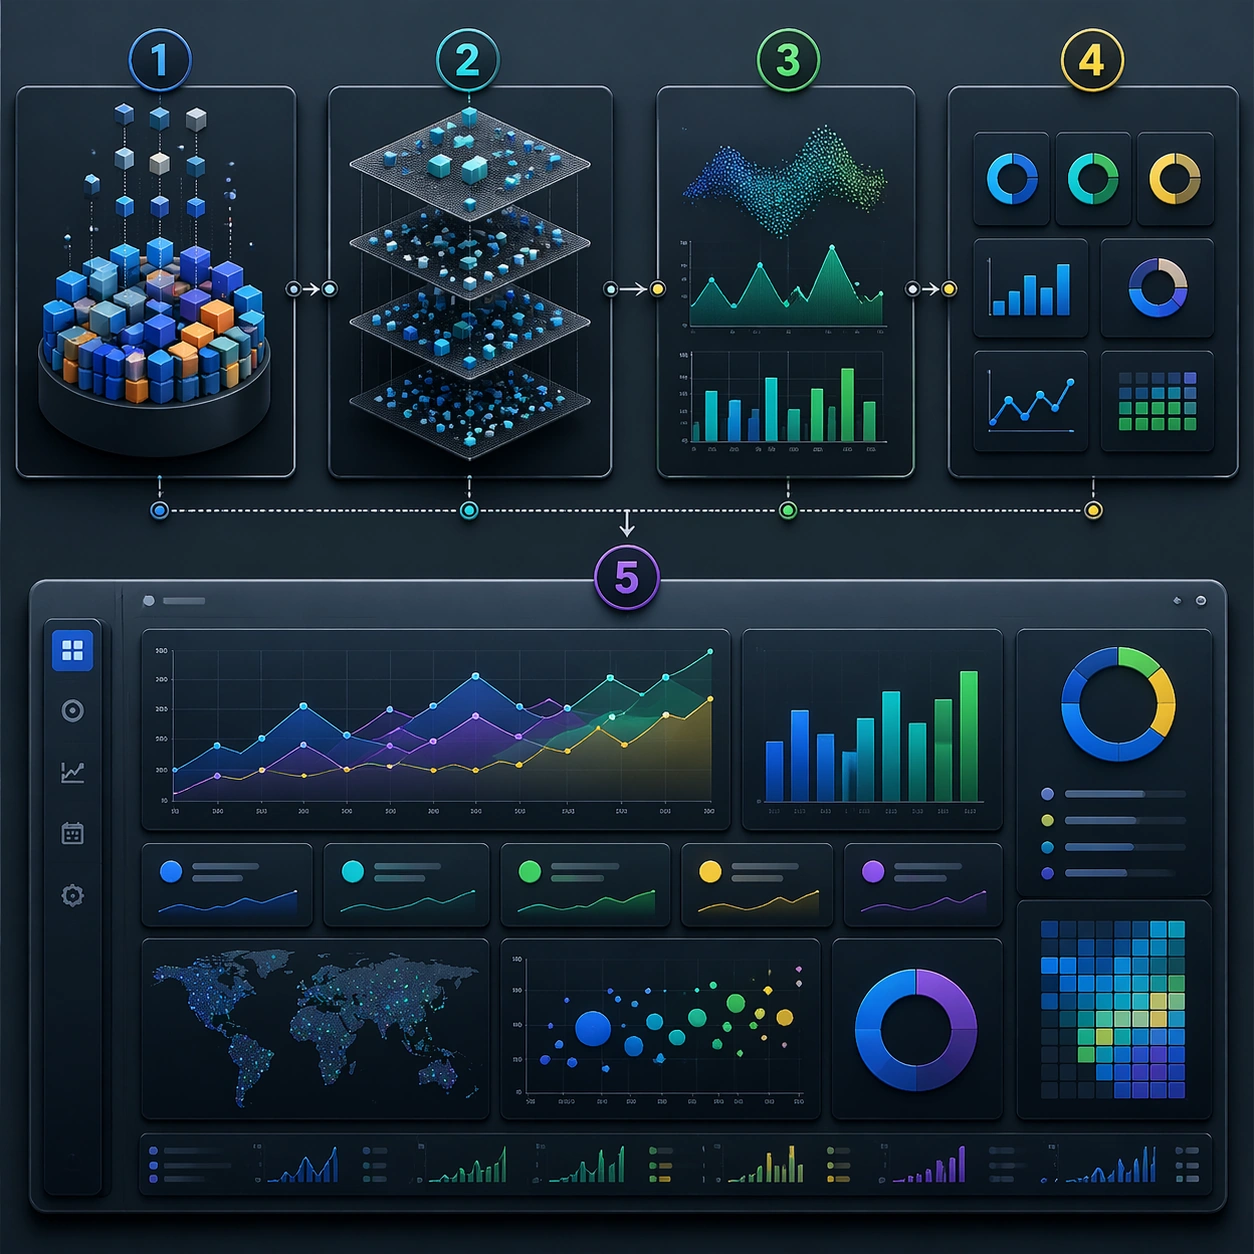
流程序列:围绕 数据可视化 Dashboard 静帧 的独立单图研究,强调该变体的关键视觉控制点。
作品信息
风格标签
提示词原文英文,可直接复制使用
Scene:
A square plate or board viewed straight-on, with crisp organization, disciplined spacing, and premium print clarity. Build the frame around a sequence of stages or states arranged in a disciplined progression. Keep the lighting, camera distance, and spatial organization tuned for a high-signal research image rather than a casual snapshot. The image belongs to the Dashboard Data Visualization theme and should feel immediately legible as a prompt atlas theme for dashboard data visualization, testing structured-layout, technical-diagram, reasoning-composition with gpt image 2..

Subject:
Center the study on a sequence of stages or states arranged in a disciplined progression. Translate the theme into a concrete visual statement instead of an abstract mood board: the viewer should understand what kind of image this is, what is being tested, and why the composition is difficult. Use the slug idea of dashboard data visualization as a literal guide for subject matter, materials, and staging. If helpful, borrow the broad visual cues suggested by CO2, UI, but keep the result original and specific to this study.

Important details:
The image should communicate logic through grouping, hierarchy, callouts, insets, and believable professional layout discipline rather than decorative noise. Preserve a disciplined square composition, clear focal hierarchy, and enough secondary information to make the image feel complete rather than underspecified. The image should look polished, novel, and exhibition-ready, with topic-specific credibility coming from the way surfaces, structure, and visual language reinforce Dashboard Data Visualization. Avoid generic filler elements that do not serve the main concept.

Use case:
Dashboard Data Visualization single study 3/8, testing structured-layout, technical-diagram, reasoning-composition through the process sequence variation.

Constraints:
No readable text, no watermark, no logos, preserve exact 1:1 aspect ratio, no readable labels, no messy arrows, no random infographic decoration, no fake UI chrome unless the topic calls for it, no broken alignment, no meaningless clutter.